
Ecosystem Health Index Report
Upper Isaac
Indicators
Phys-Chem
Nutrients
Toxicants

Ecology
Trends
Decline
Maintain
Improve
Confidence

 Download Data
Guidance on exploring graphs and data
Please find the guide below to help you in exploring the results.
Categories
Along the top of the graph there are four ecosystem health index categories:
- physical/chemical,
- nutrients,
- toxicants
- ecology.
"‘Toxicants’ is a term used for chemical contaminants that have the potential to exert toxic effects at concentrations that might be encountered in the environment" (ANZECC and ARMCANZ, 2000).
Each category has at least one and usually several indicators, located on the left side (y-axis) of the graph. Click on these indicators to find out more about each of them, including:
- what is measured
- why it is important to measure them
- what a particular grade means for this indicator?
Grades
We apply a series of calculations to the data to determine an award grade for each waterway health indicator. Hover over the grade to find out the exact score for each indicator. Compare the grade to the legend at the bottom of the graph (x-axis) to quickly see how each indicator went. Click on the legend for more details about these grades and what they mean.
Datasheet
Need more detail? Delve into the data by downloading the workbook!
For each reporting area, there is a workbook available for each waterway health category. Select the category you are interested in, then click the workbook icon from the data box just below the legend.
Once you open the file, the first sheet is the summary results for the category. It provides summary results for each indicator for three flow conditions: flow weighted; low and high.
At the category level, the score (0 to 100) and corresponding grade (E to A) is provided for each indicator. In addition, the number of sites and number of samples used to prepare the results are provided. Going one step further, you can explore the results for each indicator by selecting the sheet with the corresponding indicator name. In these sheets you will find the summary results for each site. Once again this includes a score (0 to 100) and grade (E to A) along with the number of samples that went into this grade. To give you an idea of the range of results we have also provide the minimum sample score and maximum sample score. Each site has a site ID, which keeps maintains the privacy of data providers while maintaining a reference to the data stored on the partnership database.
You can visit the grading explained section of the website to get a more detailed explanation of the scoring system used.
Overall, the ecosystem health index of monitored streams in the Upper Isaac catchment was found to be in good condition this period with:
- Mostly Excellent or Good results for physico-chemical indicators, except for Electrical Conductivity.
- Good results for nutrient indicators
- Mostly excellent results for toxicant indicators, except for Aluminium, Copper, Iron and Zinc.
- Fair or Poor results for ecological indicators
Facts about the Upper Isaac
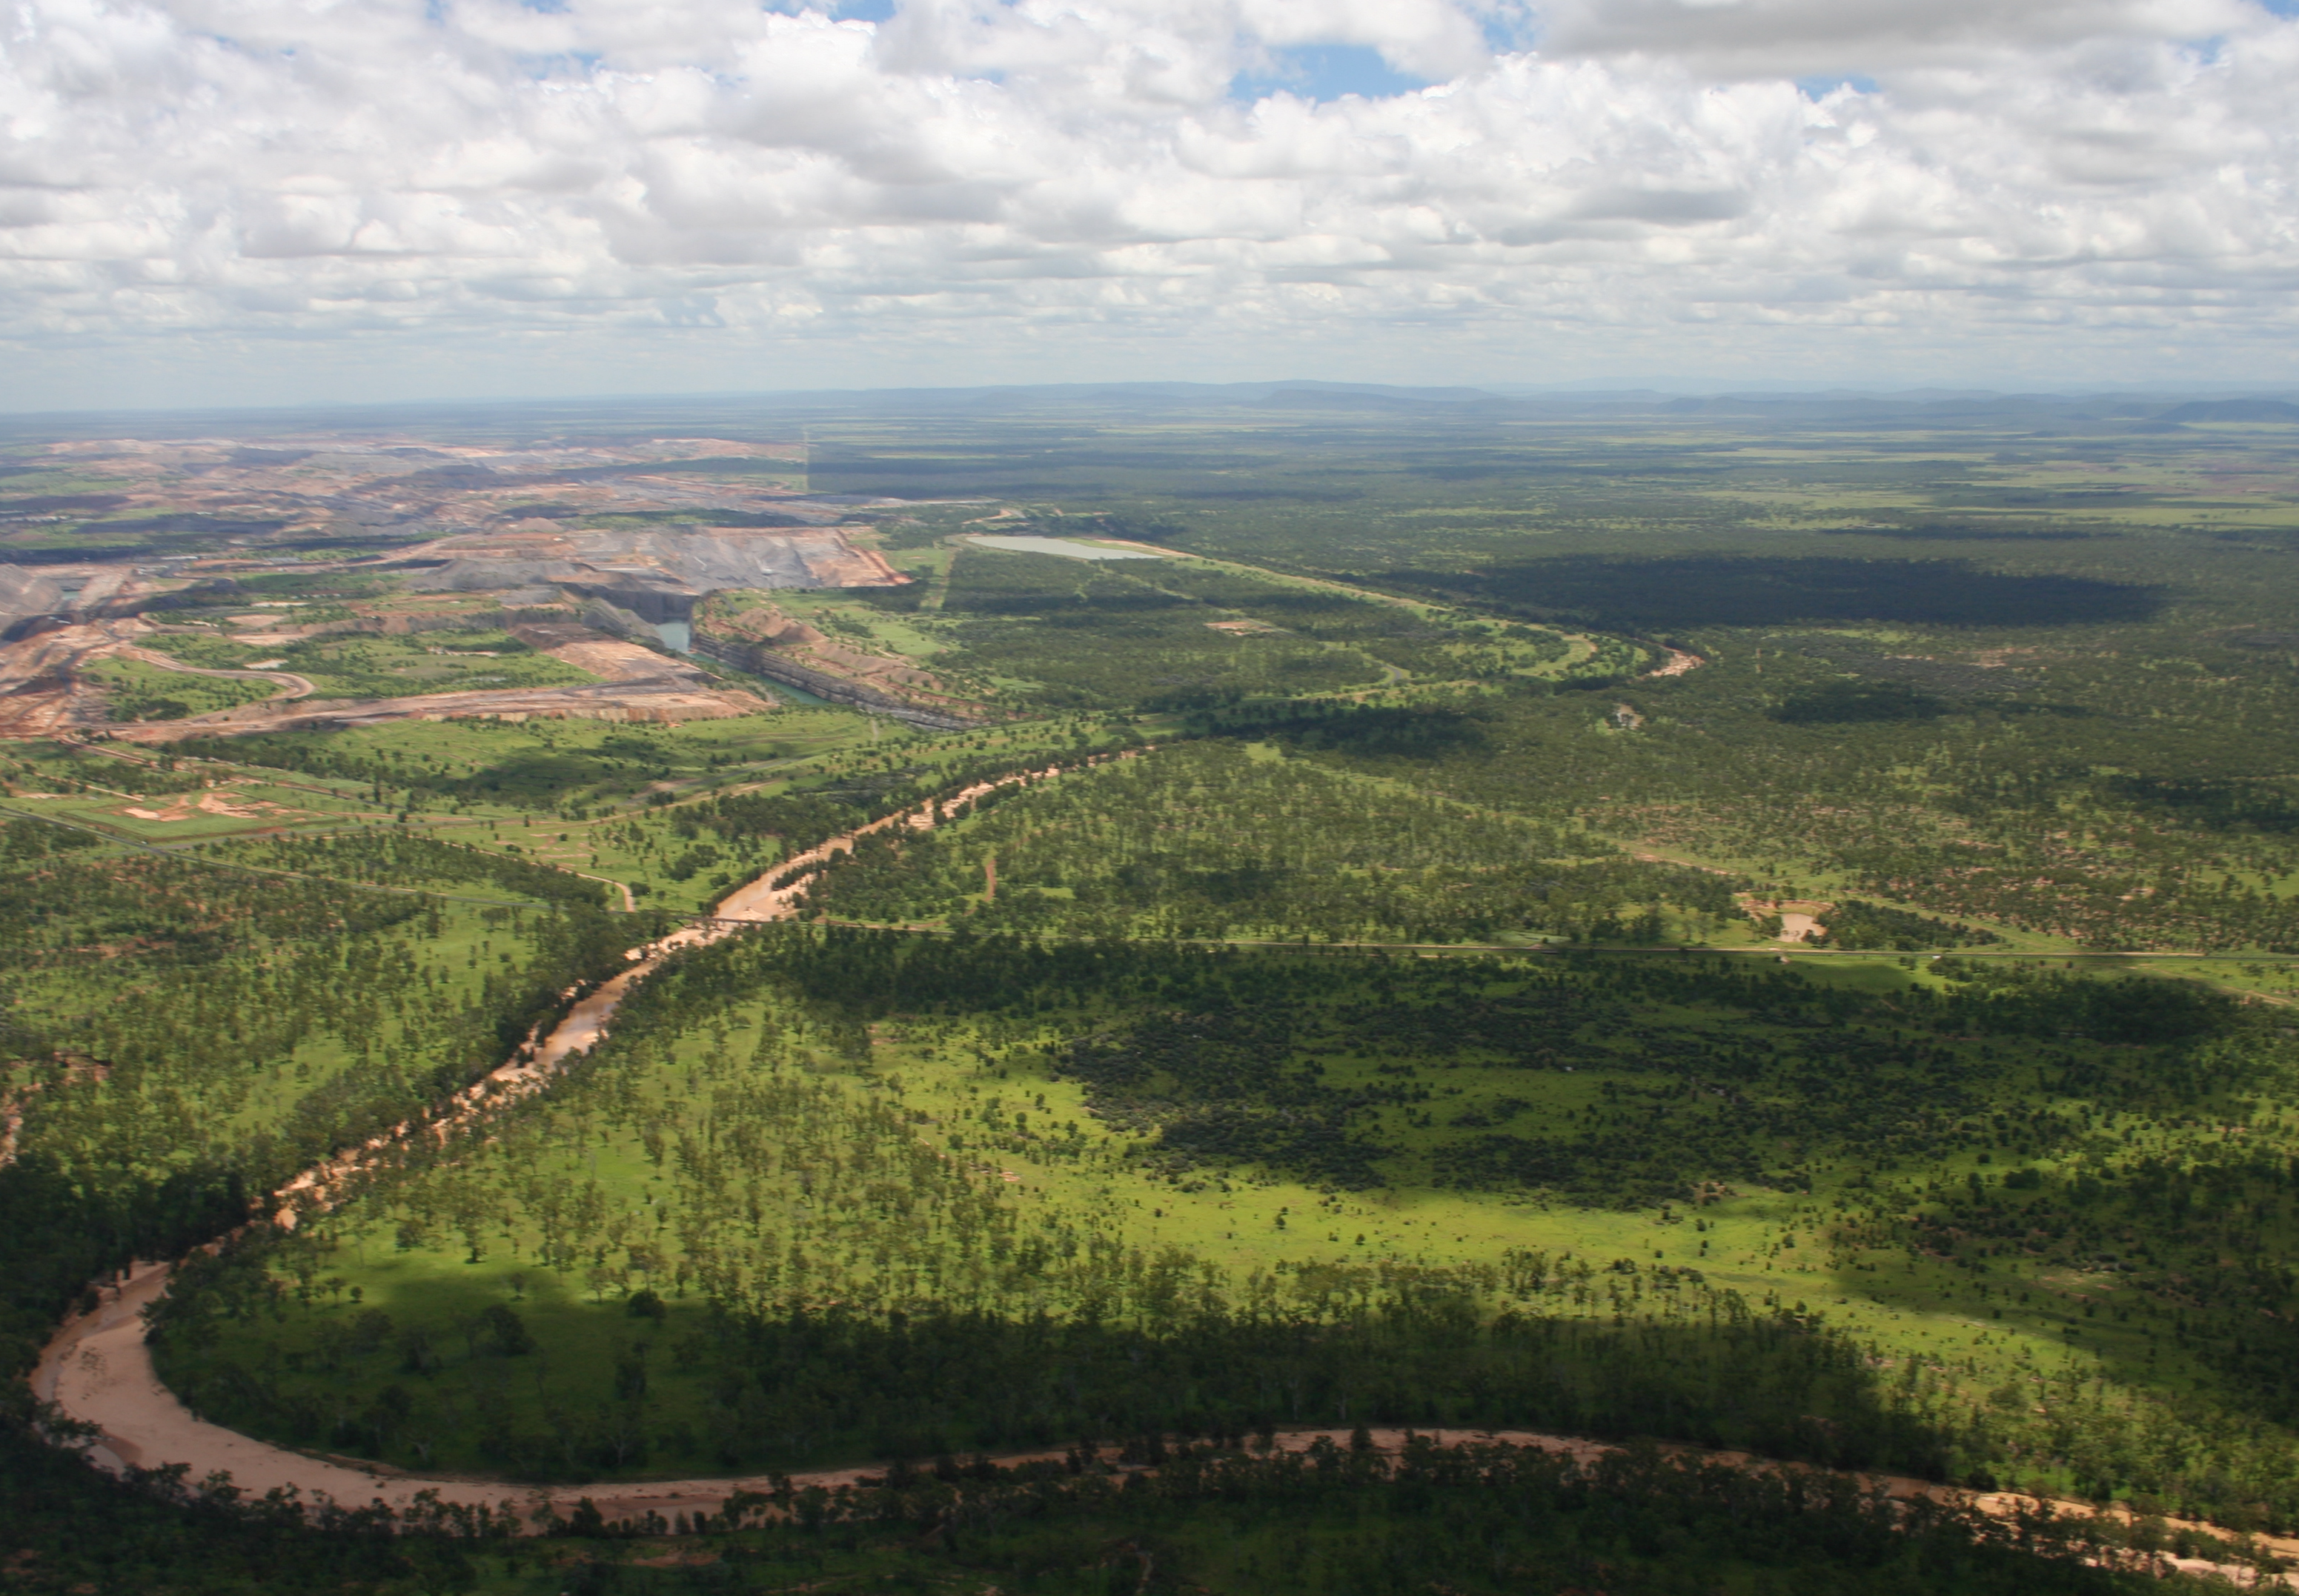
The Upper Isaac catchment is located in the north-west of the Fitzroy Basin.
The Isaac River tracks roughly south past Burton Dam and then east of Moranbah. Several creeks drain into it, including Stephens Creek (which runs past Dysart) before the Isaacs meets the junction of the Connors River, marking the start of the Lower Isaac catchment.
The Upper Isaac catchment is predominantly used for grazing. There are major coal mines in the area along with coal seam gas extraction.
Average annual rainfall is less than 600 mm for all but the north eastern ranges, which receive over 1000 mm.
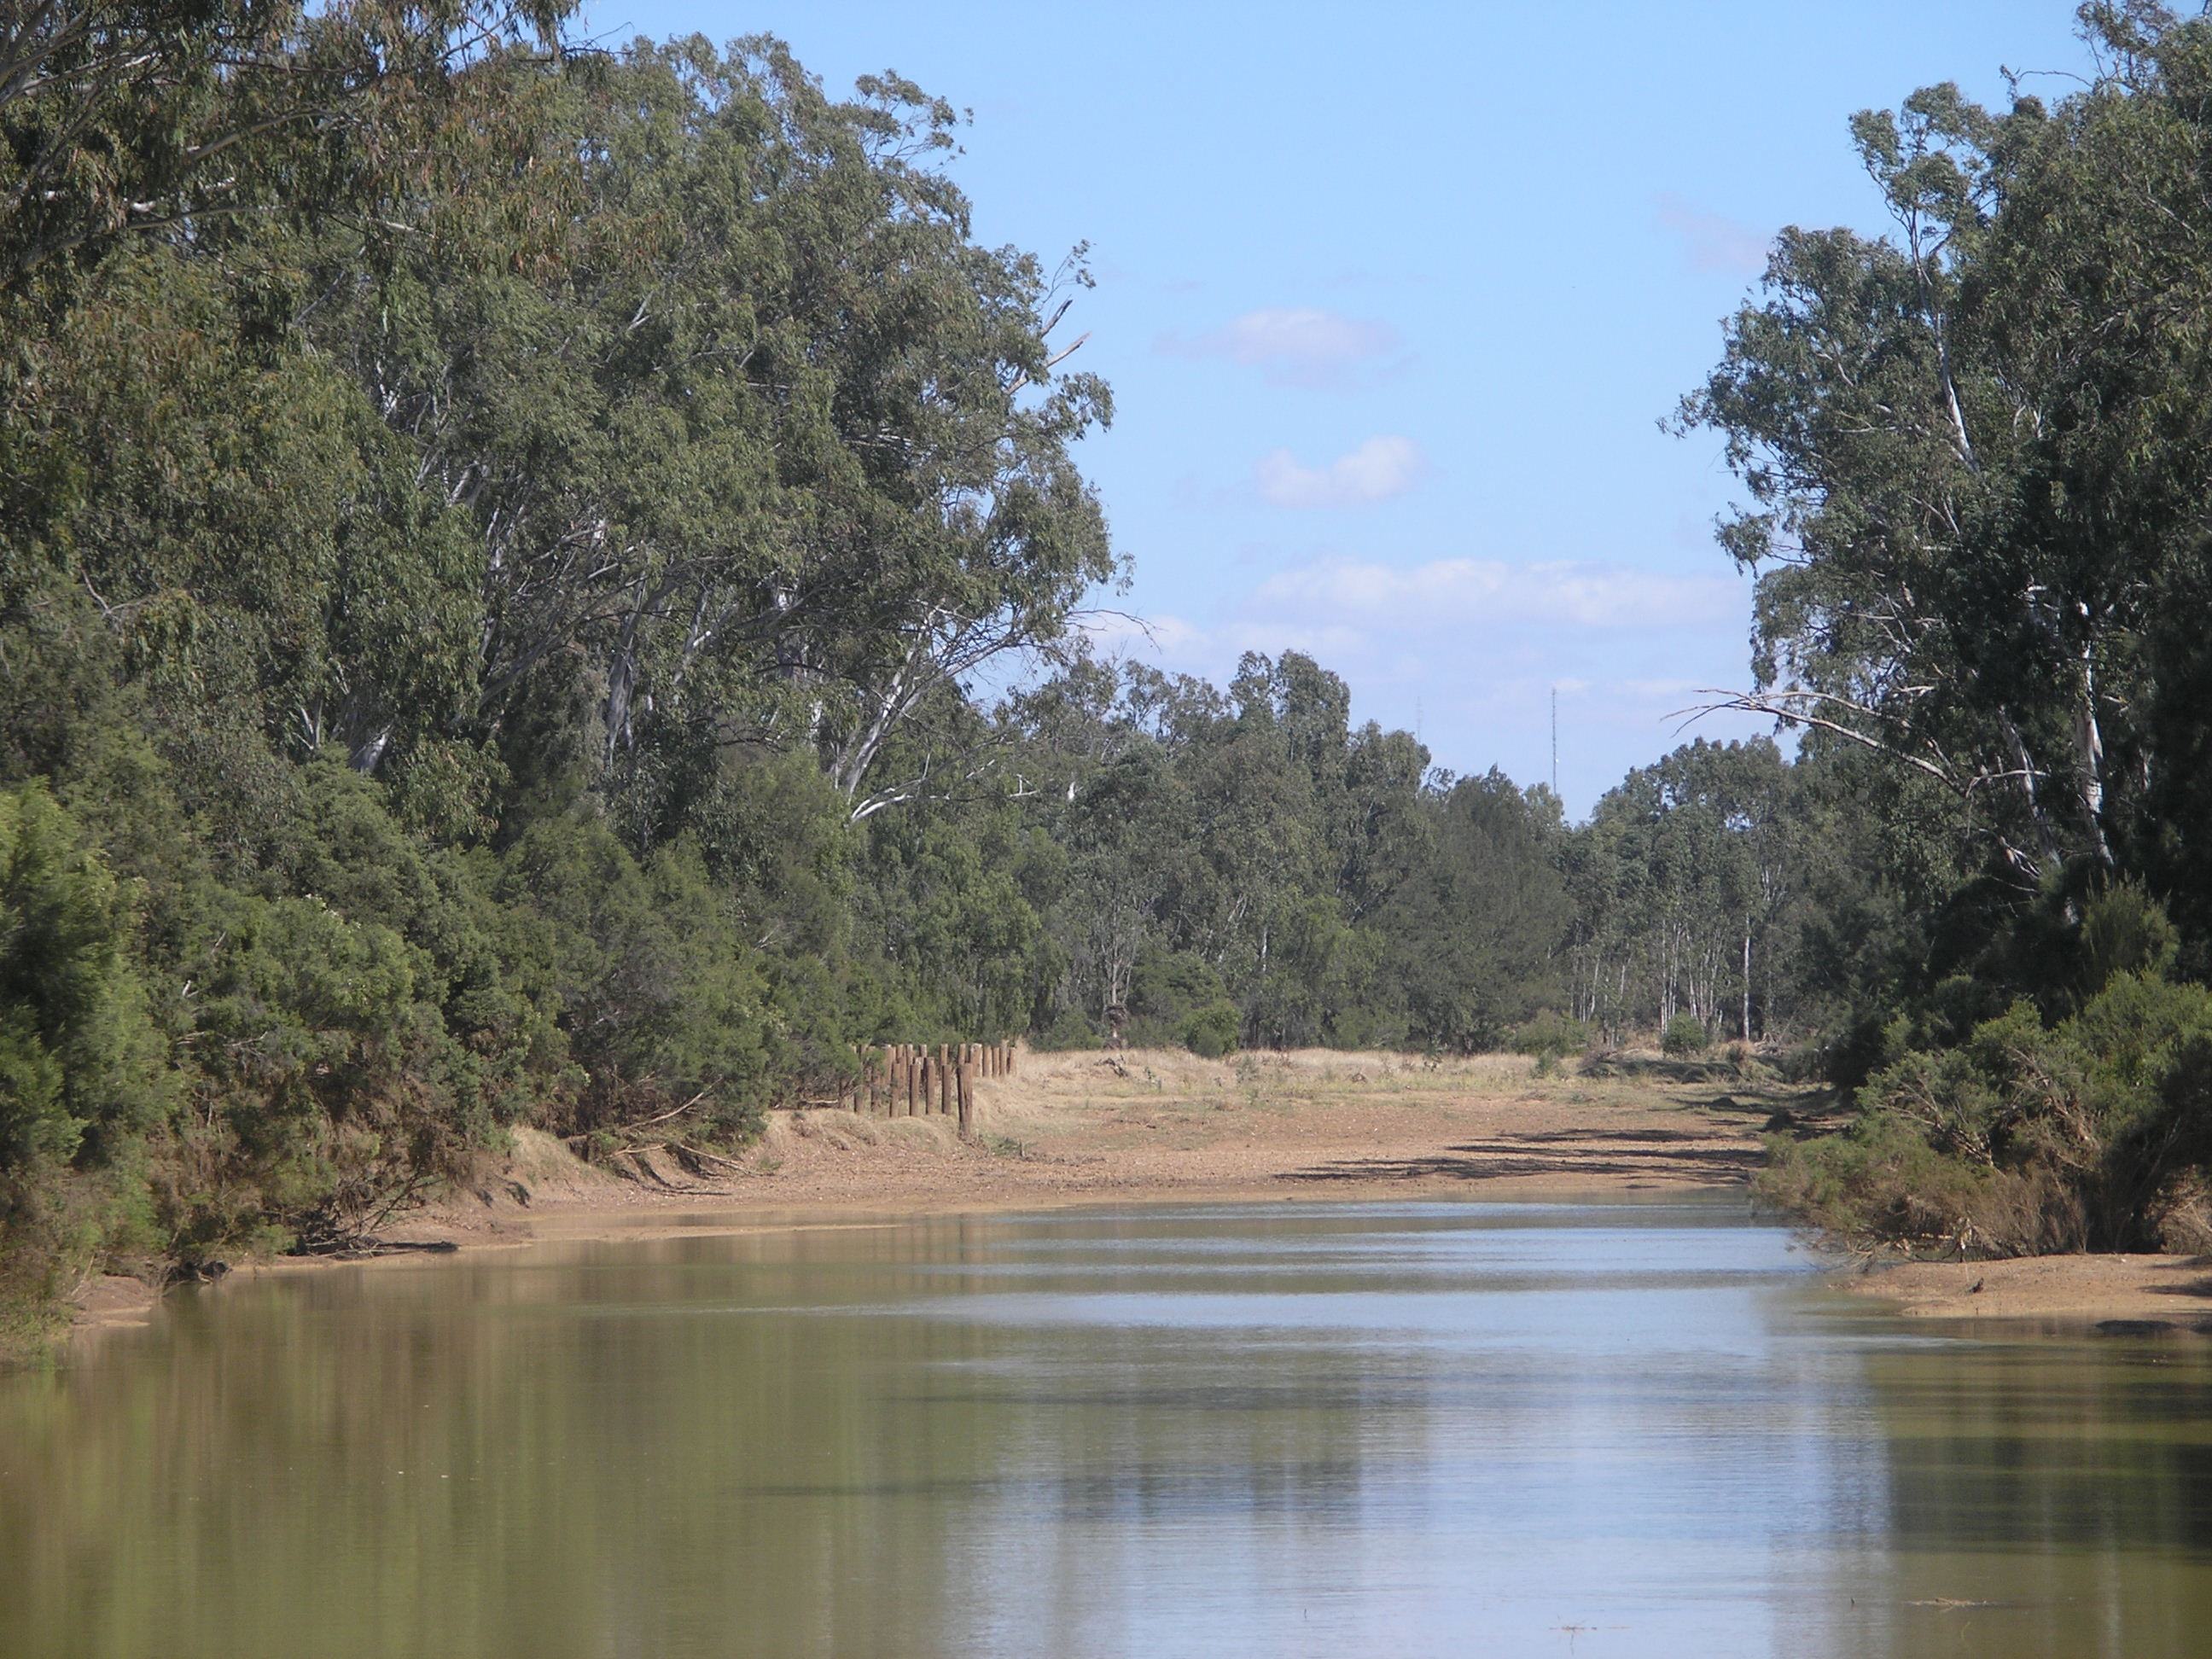
The Upper Isaac river: waterhole during the dry season
The Upper Isaac river