

Crop Use – What’s in a Grade?
Our results aren‘t simply pulled out of the sky, they have been prepared using a set of formulas and scores that are applied from the indicator level all the way to the grade for a catchment. All of these steps and their application are based on best available science along with the expert knowledge and guidance of our Independent Science Panel.
Crop Use Grades
Crop use reports use data provided by our partners. Only data from surface water monitored in creeks, rivers and on-stream storages is used. This is surface water available for irrigation. Indicators, thresholds and normalising formula are used to determine grades as covered in more detail below.
A grade is not the same as a specific irrigation water suitability for a particular water, plant and soil combination. A separate water analysis is required to determine a specific irrigation water suitability.
 |
Sometimes there is no data available to assess an indicator or a water source in a particular year. When this is the case a grey N icon is displayed. |
Summary
Crop use reports have been prepared by applying a selection of the Australian and New Zealand Guidelines for Fresh and Marine Water Quality to data provided by partners. The guidelines cover a wide range of parameters for irrigation water suitability but only chemical characteristic that may affect plant growth and contaminants have been used. The Australian and New Zealand Guidelines for Fresh and Marine Water Quality also include pesticides and radiological characteristics and Sodium Adsorption Ratio (SAR) which affects soil stability and behaviour but there is insufficient data available in the Fitzroy Basin to include these parameters in the reports for this report card.
Irrigation is a major agricultural use of water and matching water quality to plants and soils is essential for sustainable long-term production. Plant health and production can be affected by the chemical properties of irrigation water. The impact on production is climate and situation specific. Factors which need to be considered include: the sensitivity of the plant being grown, the properties of the soil under irrigation and their changes under irrigation, soil management and water management practices, climate and rainfall and depth to groundwater.
Groundwater is a significant water source for irrigation in some catchments within the Fitzroy Basin for example, Callide Creek, however, this report deals only with surface water quality from natural waters within creeks, rivers or on-stream storages.
The Partnership uses data provided by companies and government agencies to score surface waters against 22 indicators. Indicators were selected using the same criteria as for the Ecosystem Health Index and those chosen for inclusion are commonly monitored and have an available guideline for irrigation water quality. All 22 indicators have the potential to affect soil behaviour or plant growth and the threshold levels adopted are the maximum concentration of chemical component in the irrigation water which can be tolerated for a short period of time (up to 20 years). Soil type and plant species are key factors for determining production impacts of irrigation water and the report includes some of the common combinations of soil and irrigated crop species present in the Fitzroy Basin.
An irrigation water quality grading is determined using the range of indicators as outlined here. However, the suitability of a given water for irrigation of a specific plant requires a water analysis as some parameters will be limiting for a specific use of a particular irrigation water/ plant combination and also specific management practices may be required. In particular Sodium Adsorption Ratio (SAR) not assessed this year may preclude irrigation.
How are Grades Awarded
Water quality grades are provided for salinity and chemical toxicants of irrigation water.
Salinity is the dissolved salt content of water and is monitored by measuring electrical conductivity (EC). The adopted benchmark value (BM) in the crop use report is the EC of irrigation water that results in a root zone salinity level below which no adverse effect on crop production is expected based on Australian and New Zealand Guidelines for Fresh and Marine Water Quality. The adopted worst case scenario (WCS) value is the EC of irrigation water that results in the root zone salinity level that will cause a 10% loss in production based on the plant salt tolerance data in ANZECC/ARMCANZ (2000) water quality guidelines. Both these values vary for different soil and plant combinations.
Twenty one chemical components were selected from those listed in Australian and New Zealand Guidelines for Fresh and Marine Water Quality as being a potential concern in irrigation. The selected chemical components are those that are routinely measured in surface water in the Fitzroy. The threshold values adopted come from Australian and New Zealand Guidelines for Fresh and Marine Water Quality. Salt tolerance is most commonly a total salt content effect on plant growth and water availability to the plant. For some plants there can be specific ionic composition effects as well under given situations as given the following tables:
- Table 4.2.6 Chloride concentrations (mg/L) causing foliar injury in crops of varying sensitivity under spray irrigation
- Table 4.2.8 Sodium concentration (mg/L) causing foliar injury in crops of varying sensitivity under spray irrigation
- Table 4.2.10 Agricultural irrigation water long-term trigger value (LTV), short-term trigger value (STV) and soil cumulative contaminant loading limit (CCL) triggers for heavy metals and metalloids. (The STVs are more stringent and relate to the direct toxic effect to the standing crop of heavy metals in irrigation water. The STV has been adopted as the benchmark)
For each data point in the Fitzroy Basin, individual scores are given for salinity and each of 21 chemical toxicants.
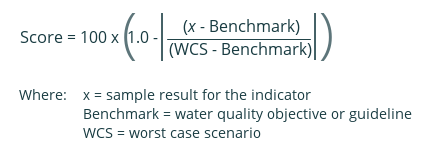
Scores for electrical conductivity (indicator for salinity) used the following formula:
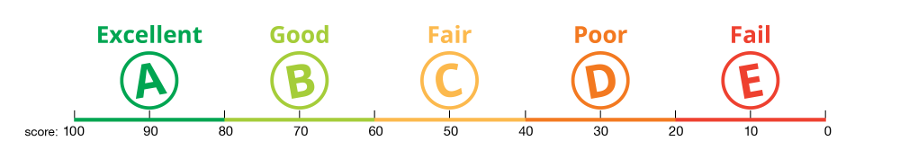
Scores for chemical components used a pass/fail scoring method where each data point is given a score of 0 or 100 for each indicator. In this method, if the result for an indicator is better than the threshold it scores 100. If the result is worse than the threshold it scores a 0. The score for each indicator was converted to an overall grade based on the following table.
| Grade | Score | Descriptor |
|---|---|---|
| A | 80 – 100 | Excellent |
| B | 60 – 80 | Good |
| C | 40 – 60 | Fair |
| D | 20 – 40 | Poor |
| E | 0 – 20 | Fail |
| N | No data | No data |
An overall site score for irrigation water quality is a weighted score calculated using the EC (salinity) score (50%) and the worst scoring chemical component score (50%).
An overall catchment score for irrigation water quality is calculated by the same method. These scores are converted to a grade based on the above table.
Indicators and Thresholds
The selected indicators and thresholds for irrigation water used in this report are based on the Australian and New Zealand Guidelines for Fresh and Marine Water Quality and SALF V2 software.
For electrical conductivity of irrigation water (ECIW), refer to table 4.2.5 from the guidelines. When applying the guidelines, soil type should be considered as soil type significantly affects crop tolerances to the salinity in irrigation water. Consequently, the relevant guideline values for soil and crop combinations commonly encountered in the Fitzroy basin were used as the benchmarks (BM) for scoring electrical conductivity.
The guidelines also include a discussion on the rate of yield decline for crops with increasing salinity. Table 9.2.10 is a compilation of plant salt tolerance data and provides some guidance on yield declines based on average root zone salinity. The worst case scenario (WCS) values used for calculating scores for electrical conductivity were extrapolated from this table. The formula used was:

Using cotton on clay as an example, ECSE threshold : ECSE 90% yield = 7.7:9.6 = 0.8.

The use of 90% yield thresholds in defining the WCS is arbitrary. It was assumed that irrigators would consider this level of yield loss as being significant and that the report card should flag situations where this potentially could occur.
The thresholds used for all indicators (in uS/cm, ug/L or mg/L) are:
| INDICATOR | UNIT | ALL SPECIES THRESHOLDS | COTTON ON CLAY BM/WCS | LUCERNE ON LOAM BM/WCS | CITRUS ON SAND BM/WCS | PEANUTS ON SAND BM/WCS |
|---|---|---|---|---|---|---|
| ELECTRICAL CONDUCTIVITY | uS/cm | 4000/5000 | 2700/4600 | 2900/3900 | 4400/4800 | |
| ALUMINIUM | ug/L | 20000 | ||||
| ARSENIC | ug/L | 2000 | ||||
| BERYLLIUM | ug/L | 500 | ||||
| BORON | ug/L | 1000 | ||||
| CADMIUM | ug/L | 50 | ||||
| CHROMIUM | ug/L | 1000 | ||||
| COBALT | ug/L | 100 | ||||
| COPPER | ug/L | 5000 | ||||
| FLUORIDE | ug/L | 2000 | ||||
| IRON | ug/L | 10000 | ||||
| LEAD | ug/L | 5000 | ||||
| MANGANESE | ug/L | 10000 | ||||
| MERCURY | ug/L | 2 | ||||
| MOLYBDENUM | ug/L | 50 | ||||
| NICKEL | ug/L | 2000 | ||||
| SELENIUM | ug/L | 50 | ||||
| URANIUM | ug/L | 100 | ||||
| VANADIUM | ug/L | 500 | ||||
| ZINC | ug/L | 5000 | ||||
| SODIUM | mg/L | 460 | 230 | 115 | na | |
| CHLORIDE | mg/L | 700 | 350 | 175 | na |
BM – benchmark, WCS – worst case scenario
SAR – potential option for the future
Sodium Adsorption Ratio (SAR) is a commonly used index of the sodium hazard of an irrigation water. It is good a prediction of the Exchangeable Sodium Percentage (ESP) of the soil when it has come to equilibrium with the irrigation water composition.
ESP is an important soil property that determines soil behaviour. In particular; soil stability, clay dispersion, soil crusting, hydraulic conductivity and potential for soil erosion. Increased salt content can improve soil structure with moderate ESP levels but surface soils have the salt diluted by rainfall and can disperse readily under raindrop impact.
Thus there is a practical limit to the SAR of an irrigation water to maintain soil structure. While the SAR value varies with soil texture, for most irrigated soils an SAR in excess of 6 will cause some soil degradation.
Incorporating SAR into the next report card is being progressed to give a more comprehensive irrigation water grading.