Additional Information
The Fitzroy Partnership also reports on additional information which is not included in the report card, usually due to limited temporal or spatial extent of associated data. This information is added to the website with a link from the Ecosystem Health Report page, and covers important topics for the Fitzroy such as rainfall, groundcover, floods and land use.
The legend used for FPRH additional information products is shown below. Note that not all of the products shown in the additional information section use this legend. Most of the additional information indicators adhere to the same grading metric outlined for freshwater and estuary.
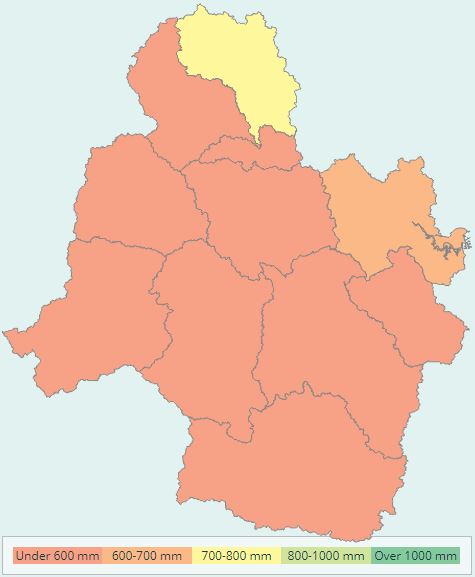
Rainfall
Annual rainfall data sourced from BOM are averaged and mapped across the 11 Fitzroy Basin catchments for each reporting year. Interannual trend is represented on a line graph and a long-term historical average (1961-1990) is also mapped across the 11 catchments.
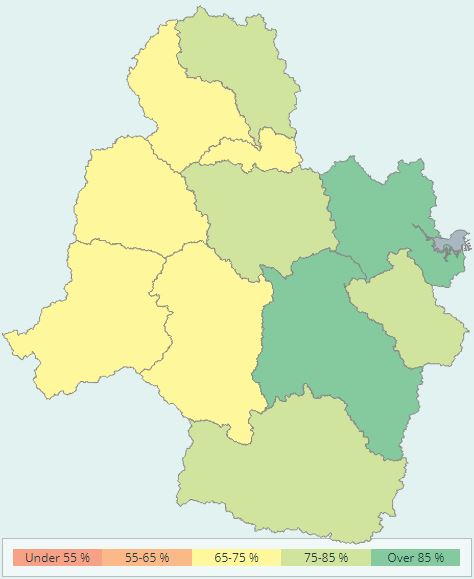
Ground Cover
Average ground cover is mapped across the 11 catchments for each reporting year using data from the Queensland Bare Ground Index. Similar to rainfall, trend is graphed and long-term average is mapped.
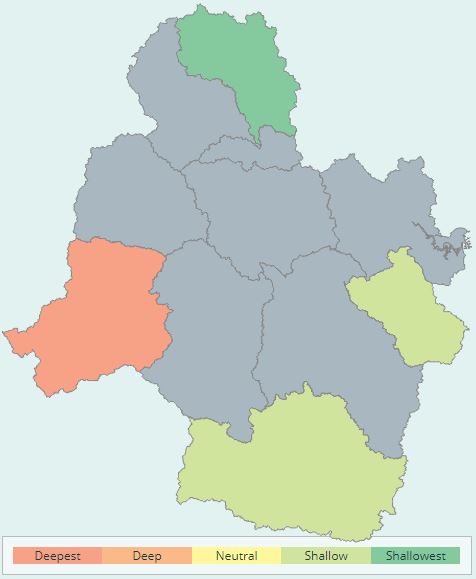
Groundwater
The shallowest groundwater level for the reporting year is mapped with an indexed five-point rating from “deepest” to “shallowest” in comparison to the 10 year long term average. Data are from Queensland Government-monitored bores in the Fitzroy Basin with continuous data sets which are only available in the Callide, Connors, Nogoa and Upper Dawson catchments. A trend graph shows changes in groundwater depth between reporting years.
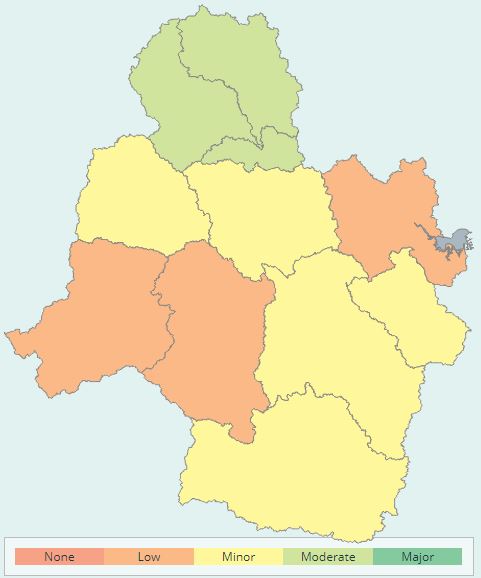
Floods
Flood grades are calculated using the site with the highest recorded depth from each catchment across the Fitzroy. A grade is assigned to the relevant catchment based on the legend below. Data are from Queensland Government-monitored sites.
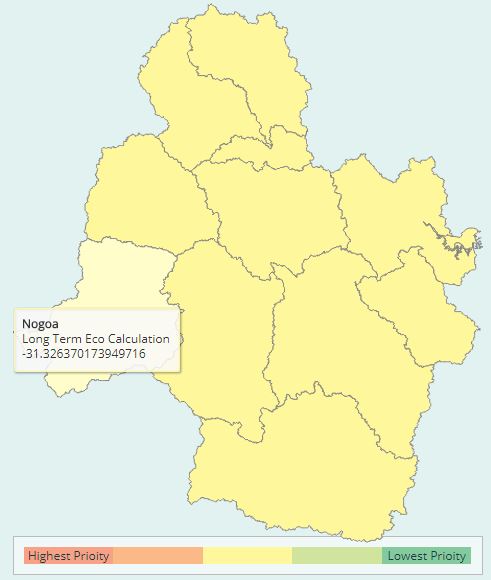
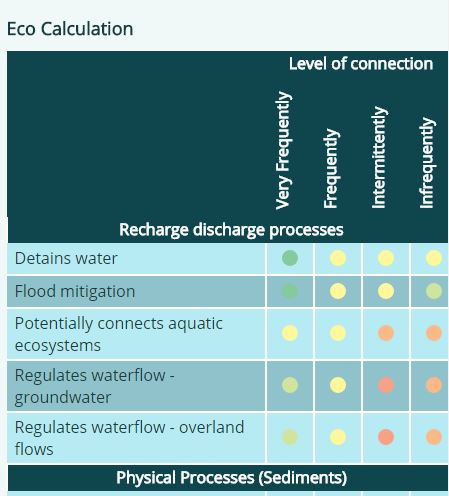
Eco Calculation
The Ecological Processes Calculator (Eco-Calculator) is a tool for assessing the changes to ecological processes provided by coastal ecosystems, that support the health and resilience of the Great Barrier Reef.
The calculator scores the current capacity of ecosystem services, per catchment, against that of pre-European condition. When combined with the Blue Maps tool, the calculator can be used to forecast the impacts of improved practices on ecological processes, as a tool for restoration planning.
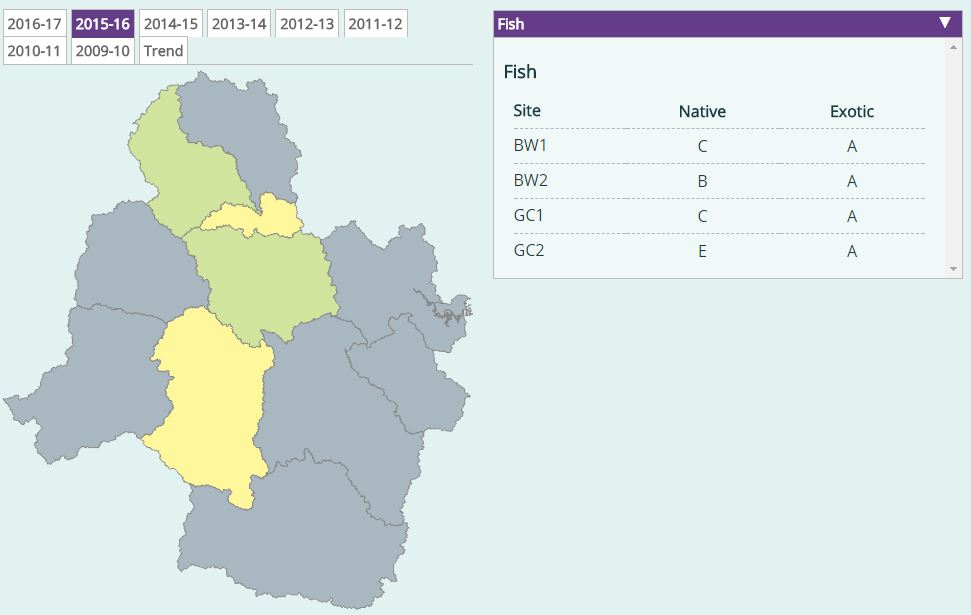
Fish
The ratio of Observed to Expected native species (O/E50) is calculated for each site that has fish data available in each catchment. Expected species are derived from the Fitzroy region WQOs supporting document. Each site is assessed and given a score and grade, which are averaged across each catchment to provide catchment scores and grades.
Indicators of native species richness and exotic species are included in the fish category to compare locations and catchments:
- Native species richness – The ratio of Observed (sample results) to Expected Native Species (O/E50= number of species Observed, divided by the number of species Expected); and
- Exotic species – The change in numberof exotic (or introduced) fish.
A grade for Fish at a location or for the catchmentis calculated by:
- Identifying the catchmentin which the monitoring site (with fish data) is located and consequently the expected number of native and exotic species for the catchment in the Sub-basin Environmental Values and Water Quality Objectives;
- Tallying the observednumber of native fish species and the number of exotic species at the site (from data provided);
- For native species richness, use the Ratio equation (O/E50 ) to divide observednumber of native fish speciesby expectednumber of native fish for each monitoring site ;
- The greater the ratio is (O/E50 ), the better the aquatic ecosystem health is considered to be (Platten, 2011).
- The ratio result (or score) calculated is then given a grade by applying the following guideline values:
- A Grade has a score > 1
- B Grade has a score > 0.8 and = 1
- C Grade has a score > 0.6 and = 0.8
- D Grade has a score > 0.4 and = 0.6
- E Grade has a score = 0.4
- For exotic species, determine if number of species is more or less than expected.
- The result is given a grade by applying the following values:
- A Grade has an observed exotic species number of 0
- B Grade is not used in this assessment.
- C Grade has an observed exotic species number = expected number but > 0
- D Grade has an observed exotic species number > expected number by 1
- E Grade has an observed exotic species number > expected number by 2
- N is used where no fish were present (native or exotic).
Fish Barriers
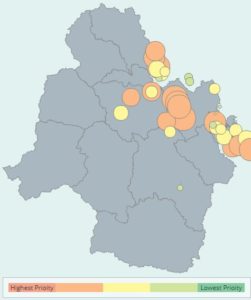
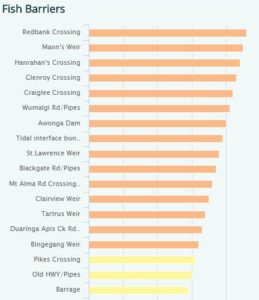
In 2008, FBA funded a project to identify barriers to fish passage. The project conducted a desktop study and tested some of the findings to identify all potential barriers to fish passage in the Basin and prioritise these barriers for remediation. Barriers to fish passage included any structure that impeded the movement of fish, such as culverts, pipes, road crossings, weirs and dams. A map identifying barriers and locations of hot spots within the Fitzroy catchment can be viewed on the left. Over 10,000 barriers were identified and the map displays where most barriers are found. As part of the WQIP:2015, the 2008 prioritisation has been revised and updated. Refer to this page here for more detail and the 46 priority fish barriers identified for remediation.
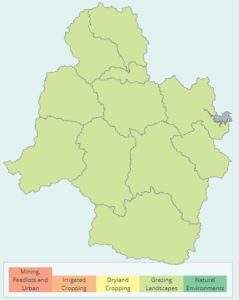
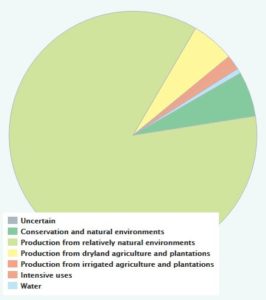
Land Use
Spatial distribution of land use categories is mapped and a pie chart illustrates percentage land use across the Fitzroy Basin. Categories reported include:grazing, cropping, natural land, forestry and urban, mining and feedlots. Data are sourced from the Queensland Land Use Mapping Program.
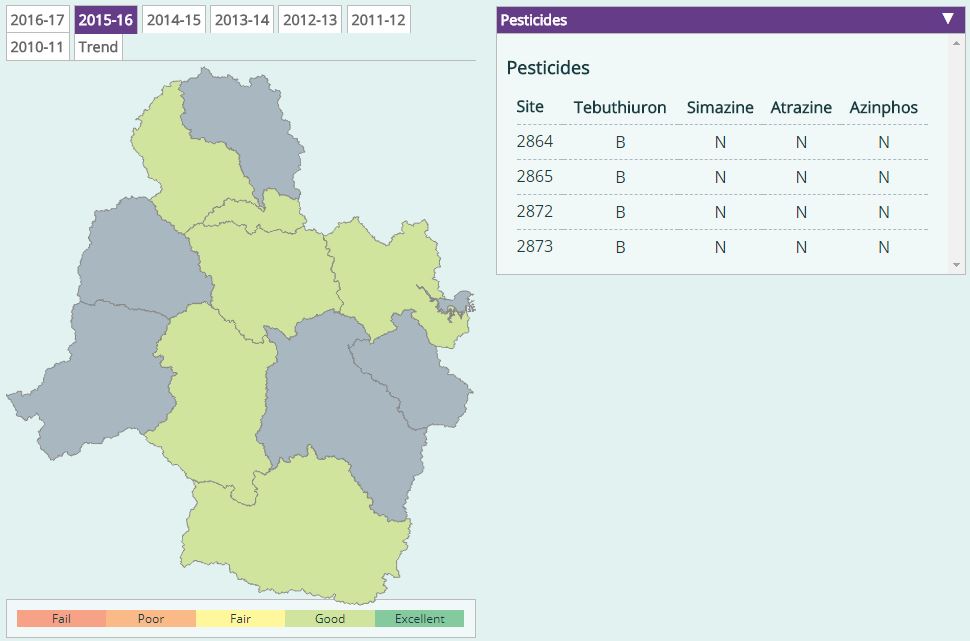
Pesticides
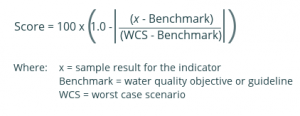
Pesticide data for four sub-indicators are assessed against benchmarks and worst-case scenarios (ANZECC 99% and 80% protection of species, respectively). The sub-indicators are: Atrazine, Simazine, Tebuthiuron and Azinphos(methyl). Assessed scores are averaged per site, and then again across all sites at the catchment scale to provide catchment scores and grades for pesticides where data are available. The EHMP formula used the Water Quality Objective (WQO or Benchmark) and the Worst Case Scenario (WCS) to calculate scores and subsequently grades for pesticides.
| INDICATOR | UNIT | Water Guidelines |
|---|---|---|
| Tebuthiurion | ug/L | WQO = 0.02 or less |
| ug/L | WCS = 160 or more | |
| Atrazine | ug/L | WQO = 0.7 or less |
| ug/L | WCS = 45 or more | |
| Azinphos | ug/L | WQO = 0.01 or less |
| ug/L | WCS = 0.11 or more | |
| Simazine | ug/L | WQO = 0.2 or less |
| ug/L | WCS = 35 or more |