[wqip-tabs]
Floods
Most of the water that flows out the Fitzroy region comes down the Fitzroy River. The smaller coastal catchments (the Boyne, Calliope, Styx, Shoalwater and Water Park) contribute about 20% of the flow that discharges from the region.
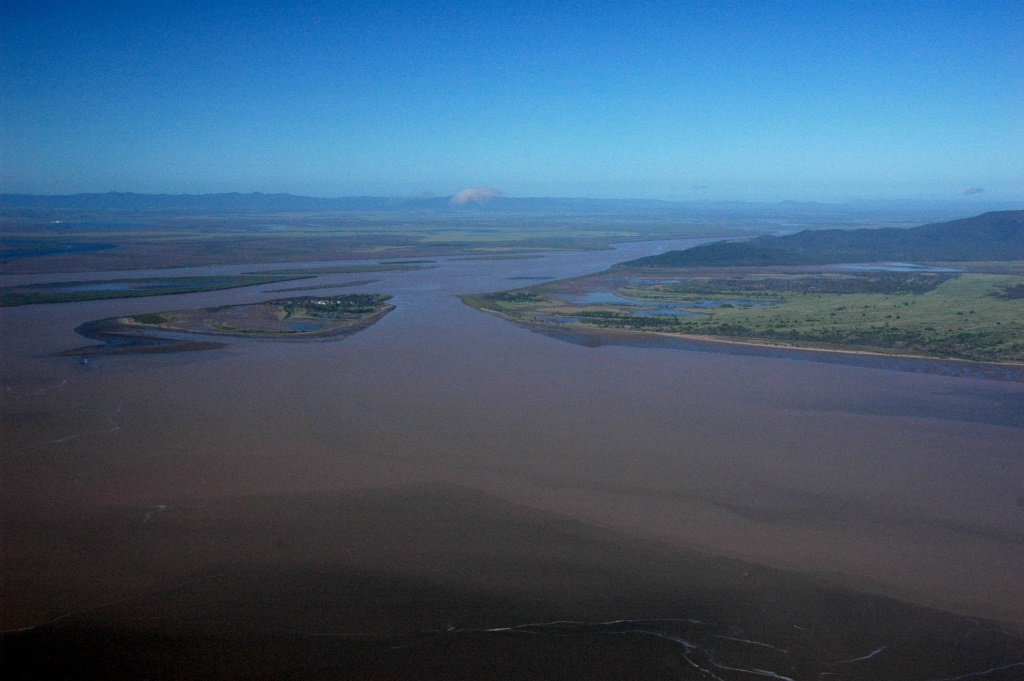
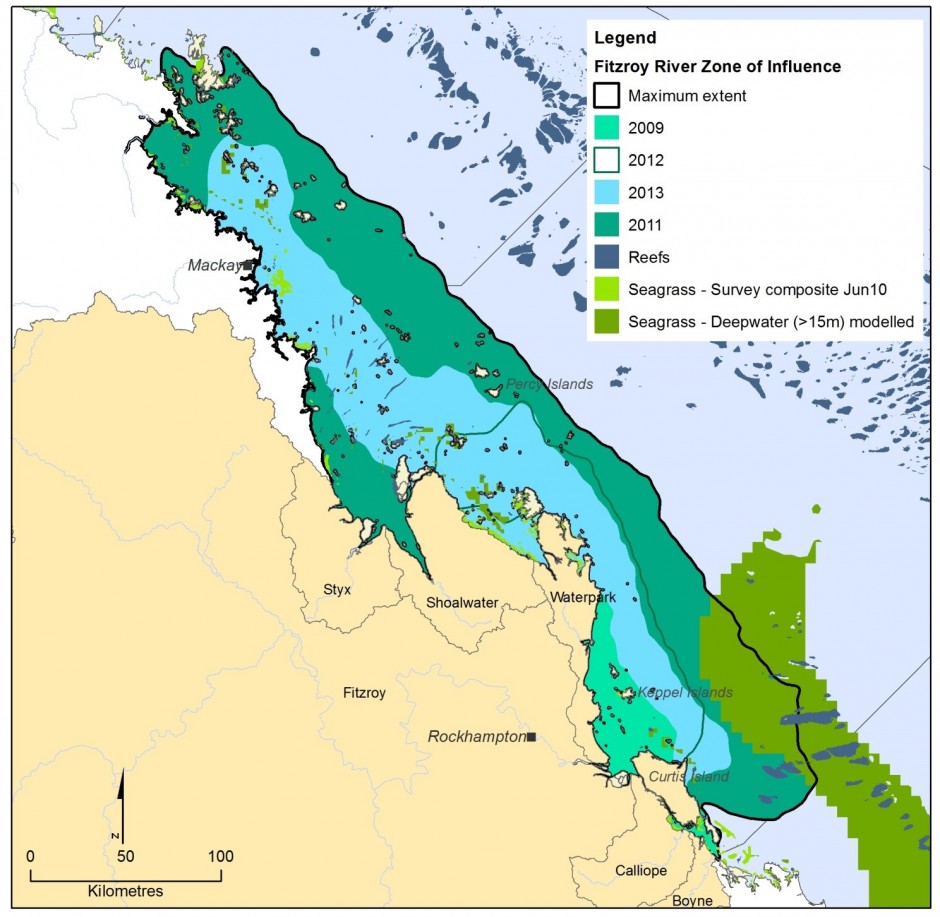
The average annual flow from the Fitzroy River is estimated to be about 5,800 Gl (gigalitres, [a billion litres]). Most flow occurs in the summer months, but flows are highly variable from year to year. Large floods are usually caused by sub-tropical cyclones or large low pressure systems (east coast lows), such as ex-tropical cyclone Tasha in late 2010/2011 and Ex-Tropical Cyclone Oswald in 2013. In extreme years, flood waters from the Fitzroy can reach as far out as the Capricorn-Bunker Group and as far north as the Whitsunday Islands (see image above).
Use the tabs on the above left to view data and information on flood plumes by year/event.
At Rockhampton, the highest recorded flood level was 10.11 metres, in January 1918. The most recent major flood occurred from the end of December 2010 to early January 2011, with a flood peak of 9.20 metres. This flood event also provided Emerald, Rolleston and Theodore with their largest floods on record. The heaviest rains fell during the period December 26 to 28, with falls of up to 300 mm recorded over a large area of the catchment and with a few reports of a maximum of 400 mm. Much of the region was isolated for several weeks, with the main highways to Rockhampton’s south and west closed, and the airport flooded.
The graph below depicts flow heights in the Fitzroy River since 1964, recorded at The Gap gauging station, located approximately 55 kilometres north-west of Rockhampton. Major floods (above 16 metres) occurred here in 1988, 1991, 2008–9, 2010–11 and 2013. The Gap gauging station is used as an indicator of flooding levels further downstream at Rockhampton.
Hover over the graph below to view flood heights at The Gap gauging station. Below minor flood levels are indicated in dark green, minor (10-14 metres) flood levels in light green, moderate (14-16 metres) in yellow and major floods (above 16 metres) in orange.
[wqip-data component=’floods’ category=’2014′]


