Freshwater and Estuary – What’s in a Grade?
Our results aren‘t simply pulled out of the sky, they have been prepared using a set of formulas and scores that are applied from the individual sample level all the way to the Basin grade. All of these steps and their application are based on best available science along with the expert knowledge and guidance of our science panel.
Freshwater catchments and Estuary
The freshwater and estuary reporting areas are assessed using indicators, thresholds and a normalising formula.

No Data
 |
Sometimes there are no data available to assess an indicator. When this is the case a grey N icon is displayed. |
Imputed Data
This calculated score is the previous year’s score for the indicator, which has been adjusted by the average % change at the basin scale, using these steps:
- Compile all site results for the indicator across all the catchments of the Fitzroy Basin.
- Remove any sites which don’t have data for both the current year and the previous year.
- Calculate the Fitzroy Basin average score for the indicator for the current year and for the previous year.
- Calculate the % change in score between the previous year and the current year.
- Apply this % change to the indicator score that was the previous year’s score in the catchment with the missing data.
- Use the calculated value to score the indicator for the catchment.
How are Grades Awarded?
How the Basin is scored
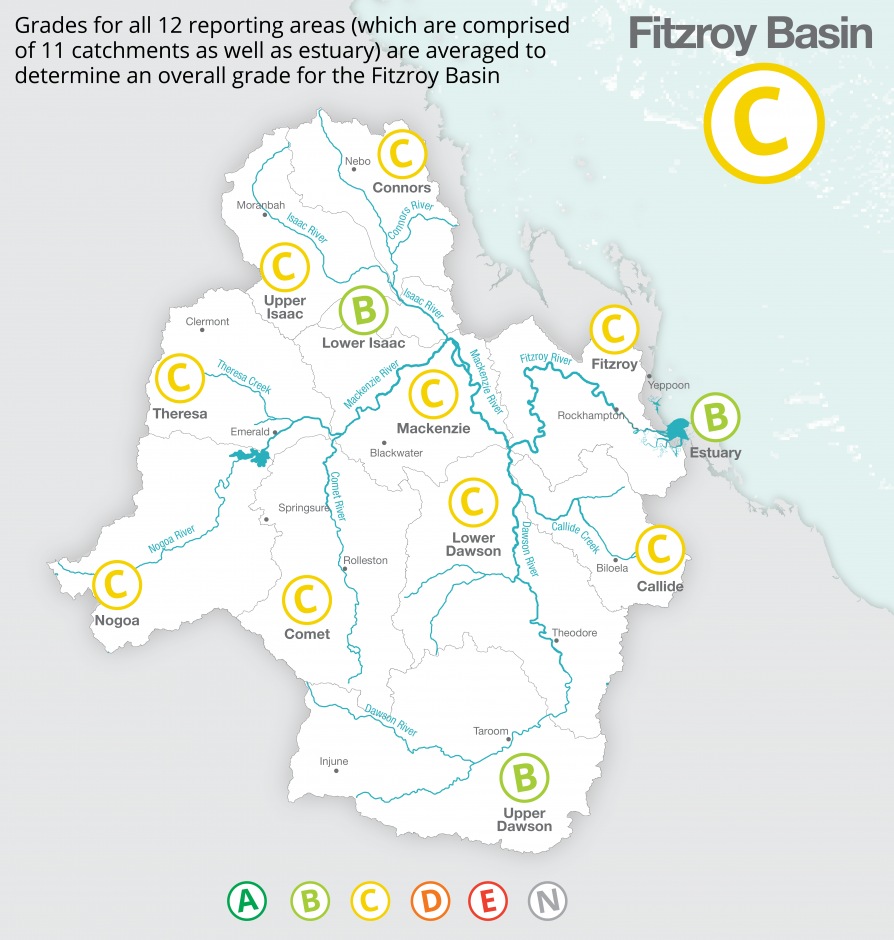
How the Reporting areas are scored
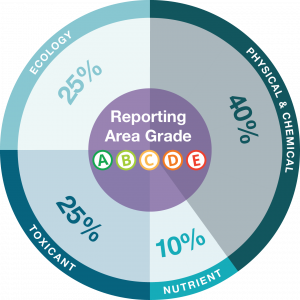
Indicator categories have a weighted average applied to them. You can see the break-down below.
Freshwater
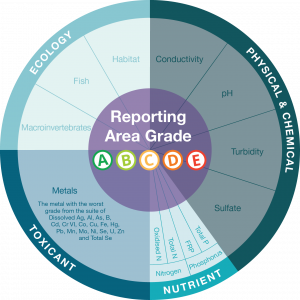
Freshwater indicators categories include physical/chemical parameters, nutrients, toxicants and ecology. There are a range of indicators within these categories which measure important aspects of ecosystem health. Together they contribute to a holistic picture of waterway health in the Fitzroy Basin. Each of the indicator categories contributes a certain percentage towards the overall reporting score.
Physical & Chemical
Physical–chemical parameters (often called phys-chem) include:
- Conductivity – Measuring the ability of the water to conduct electricity provides information about the concentration of dissolved solids that are present. Higher conductivity equates to higher dissolved ions or salts which make the water more saline. Freshwater contains less salinity than the estuary or marine zones.
- pH – pH is a measure of acidity or alkalinity. In water, a neutral pH (pH value of 7), which is neither acidic nor alkaline, enables life to thrive.
- Turbidity – This is a measure of the amount of sediment, dirt, organic material and other matter suspended in waterways. Water clarity allows light penetration for aquatic life to grow. Suspended sediment may also contribute to other physical and chemical interactions in waterways.
- Sulfate – Dissolved sulfate concentrations interact with other physical-chemical components in waterways as well as nutrients which can negatively impact aquatic life and water toxicity.
The individual physical and chemical properties of the water can vary considerably and each of the parameters interact and can impact the other. For example, pH and conductivity can both be influenced by the temperature of the water.
Nutrients
Nutrients are important for plant and animal life to thrive; however excess nutrients cause imbalances in the system which can negatively impact aquatic life and water toxicity. Nutrient parameters include:
- Nitrogen
- Phosphorous
Toxicants
Toxicant parameters include dissolved metals. Whilst many of these are essential for life, in high concentrations, some can be toxic to aquatic life.
- Arsenic (As)
- Aluminium (Al)
- Boron (B)
- Cadmium (Cd)
- Chromium (Cr)
- Cobalt (Co)
- Copper (Cu)
- Iron (Fe)
- Lead (Pb)
- Manganese (Mn)
- Mercury (Me)
- Molybdenum (Mo)
- Nickel (Ni)
- Uranium (U)
- Zinc (Zn)
- Selenium (Se)
Ecology
The Ecology category includes three indicators with a range of sub-indicators:
Macroinvertebrates
Aquatic macroinvertebrates are animals without a backbone, such as insects and freshwater mussels, which can be seen without a magnifying glass or microscope. The macroinvertebrate score is made up of indices which measure species diversity and sensitivity.
PET Taxa richness – Macroinvertebrates belonging to the PET (EPT) Orders – Plecoptera, Ephemeroptera, and Trichoptera are particularly sensitive to changes in their environment. This index counts the number of species within the PET Orders present.
SIGNAL index – The SIGNAL Index (Stream Invertebrate Grade Number – Average Level) measures the level of tolerance and sensitivity to poor water quality of each taxa present.
Taxa richness – This is a count of the overall species diversity.
Freshwater Fish
The Freshwater fish indicator measures species populations and diversity. It is made up of 7 sub-indicators which result in the freshwater fish index score (out of 100):
Species Composition
- Percentage of Atheriniformes – Atheriniformes is an Order of native fish which is sensitive to water quality and habitat conditions. This measures the percentage of Atherinformes in community composition.
- Number of Atheriniformes – this is a count of Atheriniformes species observed.
- Percentage of Clupeiformes and Hypseleotrids – Clupeiformes and Hypseleotrids are Orders of freshwater fish which are highly tolerant to poor water quality and habitat condition. This measures the combined percentage of Clupeiformes and Hypseleotrids in community composition.
Species Diversity
- Shannon Diversity – Shannon Diversity gives a numerical measure of species diversity, taking into account both the number of species and abundance of each species. Shannon Diversity results above 0 indicate more than 1 species present, results of 2 or more indicate a diverse freshwater fish community in the Fitzroy Basin.
- Chao 1 Estimator – The Chao 1 Estimator accounts for unobserved species, it works on the basis that the more rare species observed, the more likely there were also unobserved species present. Chao 1 Estimator results above 6 indicate high likelihood of unobserved rare species occurrence.
- Introduced Species – Introduced fish species pose a threat to native fish communities. They are also often found in ecosystems with poor water quality and habitat condition.
Trophic Composition
- Percentage of Omnivores – Omnivores are found in waterways with diverse fish communities, good habitat condition and water quality.
Habitat Condition
Habitat Condition is assessed using the QLD AUSRIVAS habitat rapid assessment tool. This results in an indexed score across 9 categories. These categories assess various important components of stream habitat condition:
- Bottom substrate/ available cover (score out of 20)
- Embeddedness (score out of 20)
- Velocity/depth (score out of 20)
- Channel alteration (score out of 15)
- Bottom scouring and deposition (score out of 15)
- Pool/riffle, run/bend ratio (score out of 15)
- Bank stability (score out of 10)
- Bank vegetative stability (score out of 10)
- Streamside cover (score out of 10)
Estuary
Estuary categories are the same as freshwater, except without toxicants. The Physical/Chemical, Nutrient and Ecology categories contribute 53.3%, 13.3% and 33.3% respectively towards the overall estuary score.
Marine
Marine monitoring reflects the condition and trends of important ecosystems in inshore waters and water quality. This assessment is made possible by the Marine Monitoring Program coordinated by the Great Barrier Reef Marine Park Authority (GBRMPA) and including major partners, the Australian Institute of Marine Science and James Cook University.
The assessment of the inshore marine health in the Fitzroy region is based on three categories: water quality, coral, and seagrass. Indicator explanations below are taken from the MMP reports that can be found at the GBRMPA ELibrary: Browsing the ELibrary.
Water Quality
- Water clarity (Total Suspended Solids (TSS), Secchi depth, turbidity):
- TSS is a measure of the suspended particulate material in the water column. These solids include suspended sediments (sand, silt, and clay), living plankton, and detrital (non-living organic) material. TSS concentrations are affected by oceanographic processes including primary production and wind and tide-driven resuspension, as well as inputs from other sources such as dredging and run-off from land.
- Secchi depth is a visual measure of water clarity and proxy for light penetration, which is measured using a high-contrast black and white patterned disc called a Secchi disc. The Secchi depth is the average of the vertical disappearance and reappearance depths of the disc, where clarity increases with increasing Secchi depth. Secchi depth is a simple method that has been used for over 150 years, so is excellent for assessing Long-term change and for cross-system comparisons.
- Turbidity is a measure of light scattering caused by fine suspended particles, such as sediment, detritus, and plankton. Turbidity is affected by a wide range of factors including oceanographic processes such as resuspension of bottom sediments by wind, waves and currents; river discharge; and anthropogenic factors such as dredging.
- Productivity (Chlorophyll a (Chl-a), NOX)
- Chlorophyll a (Chl-a) concentration is a measure of phytoplankton biomass in a water body. Phytoplankton grow quickly in response to nutrient availability, so elevated values of Chl-a can indicate increased nutrient loading.
- Dissolved inorganic nutrients (NH3, NOX, PO4 and Si) measure the amount of readily available nutrients for plankton growth in water samples. Inorganic nitrogen (NOx) and phosphate (PO4) represent around 1% of the nutrient pools in the Reef. The inorganic nutrient pools are affected by a complex range of biogeochemical processes including both natural (for example, plankton uptake, upwelling, nitrogen fixation, and remineralisation) and anthropogenic (for example, dredging and nutrient inputs from changed land use) processes.
- Particulate nutrients (PN and PP)
- PN and PP are measures of the suspended material retained on a filter with a pore size of approximately 0.7 μm. This material consists of a minor fraction of living biomass (for example, bacteria, phytoplankton) and a major fraction of detritus (for example, dead cells, faecal pellets). Particulate nutrient concentrations are affected by oceanographic processes (primary production, bacterial production, resuspension, and remineralisation) as well as sources such as dredging and land-based run-off.
Coral
- Coral cover as an indicator of corals’ ability to resist the cumulative environmental pressures to which they have been exposed,
- proportion of macroalgae in algal cover as an indicator of competition with corals,
- Juvenile coral density as an indicator of the success of early life history stages in the replenishment of coral populations,
- rate of hard coral cover change as an indicator of the recovery potential of coral communities due to growth, and
- hard coral community composition as an indicator of selective pressures imposed by the environmental conditions at a reef.
Seagrass
- Abundance index (per cent cover, spatial extent, species composition): Condition indicators such as meadow abundance and extent indicate the state of the plants/population and reflect the cumulative effects of past environmental conditions. Abundance can respond to change on time-scales ranging from weeks to months (depending on species) in the Reef, while meadow extent tends to adjust over longer time-scales (months to years). Seagrass extent and abundance are integrators of past conditions, and are vital indicators of meadow condition; however, these indicators can also be affected by external factors such as grazing by mega herbivores, such as dugongs and turtles. The contributions of species, with different life history strategies, differs between seagrass habitats, and varies through time based on pressures acting on the habitats. Meadows dominated by colonising species have lower ability to resist pressures, but higher capacity to recover from disturbances. Therefore, changes in the species composition of a meadow can indicate meadow state and infer disturbance levels. Community structure (species composition) is also an important feature conferring resilience, as some species are more resistant to stress than others, and some species may rapidly recover and pave the way for meadow development.
- Resilience index (reproductive effort, seed banks, meadow sediments, epiphytes, macroalgae): Seagrasses expand and produce new shoots through clonal growth, but seagrasses are also angiosperms (flowering plants). Sexual reproductive structures (flowers, fruits, and seeds) are an important feature of a healthy seagrass meadow. Sexual reproduction is necessary to form seed banks, which facilitate meadow recovery following periods of decline, and seed germination increases clonal diversity of the meadow (richness). The level of reproductive effort (reproductive structures per unit area) by a meadow in each season provides the basis of new propagules for recruitment in the following year. Sediment grain size affects seagrass growth, germination, survival, and distribution. Coarse, sand dominated sediments limit plant growth due to increased mobility and lower nutrients. However, as finer-textured sediments increase (dominated by mud (grain size <63μm)), porewater exchange with the overlaying water column decreases resulting in increased nutrient concentrations and phytotoxins such as sulphide, which can ultimately lead to seagrass loss. Epiphytes and macroalgae are an environmental indicator because they can compete with and/or block light reaching seagrass leaves, therefore compounding environmental stress.
How Monitoring Sites are scored
A flow weighting is applied to catchment indicator grades when they are averaged up to a category grade.
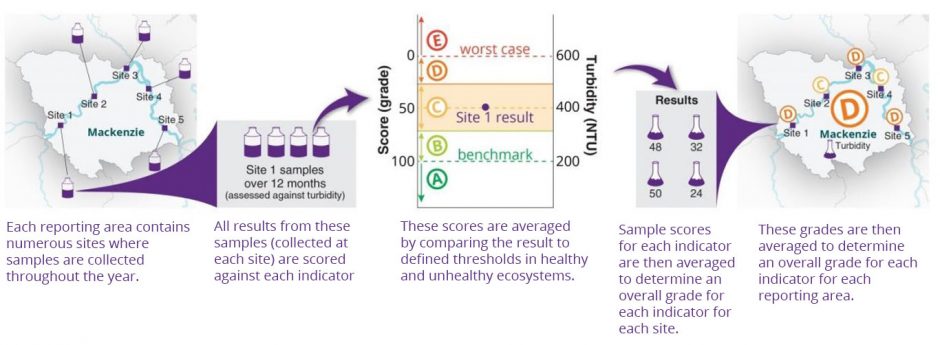
Formula, Indicators and Thresholds
Assessment Formula
If a sample result for an indicator is better than the benchmark, it scores 100 which is an A. If the sample result is worse than the worst case scenario (WCS) it scores a 0 which is an E. If a sample result is between the benchmark and the WCS, the score is calculated using the formula:
This formula standardises the sample result in to a score between 0 and 100, and is based on the formula used in and developed by the South East Queensland Ecosystem Health Monitoring Program.
Indicators and Thresholds
The following table shows all the indicators for the freshwater and estuary reporting areas and the benchmarks and worst case scenarios used in calculating the grades. Use the drop-down menu to change the reporting area.[indicator_threshold_table]
(1) All metals are dissolved except Selenium, which is Total (due to no guidelines for dissolved).
(2) WQG = Water Quality Guideline or other benchmark.
(3) WCS = Worst Case Scenario.
Click here to download table as an Excel workbook

