
The Ecological Processes Calculator (Eco-Calculator) is a tool for assessing the changes to ecological processes provided by coastal ecosystems, that support the health and resilience of the Great Barrier Reef. The calculator scores the current capacity of ecosystem services, per catchment, against that of pre-European condition. When combined with the Blue Maps tool, the calculator can be used to forecast the impacts of improved practices on ecological processes, as a tool for restoration planning.
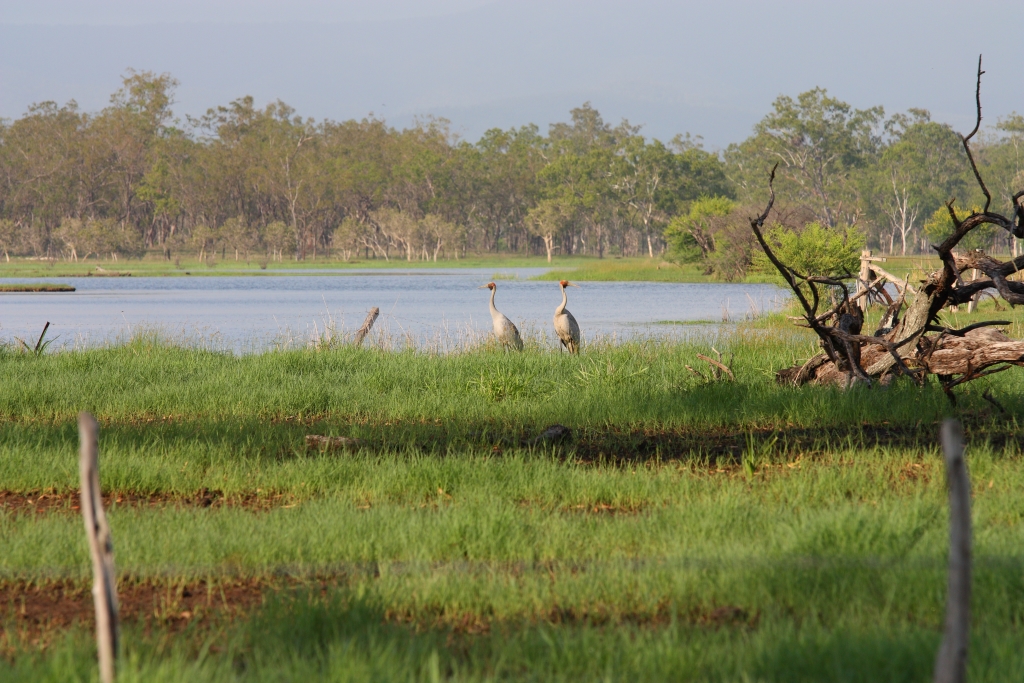
Ecological processes provided by coastal ecosystems are critical for the long-term health and resilience of the Great Barrier Reef. Ecological processes include biological, biogeochemical and physical processes. For example, coastal ecosystems such as wetlands trap water, allowing biofilms and aquatic algae to grow and assimilate heavy metals. They also allow sediments to settle and nutrients to be cycled. Wetlands slow down the velocity of overland flows, allowing greater groundwater recharge and more residual time for ecological processes to occur. They are important habitats and refugia for species connected to the Reef.
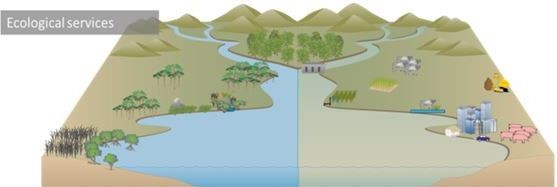
The Eco-Calculator scores the current ability of catchments to provide ecosystem services relative to their pre-European condition. This image shows an example of a pre-clear ecosystem (left) compared to a present-day ecosystem (right) (illustration courtesy of GBRMPA 2015).
The below table shows how the Fitzroy Basin scores against different ecosystem services parameters (left-hand vertical axis), compared to the level of connectivity of each coastal ecosystem to the Reef (horizontal axis). For example, for physical processes (sediments), intermittently connected ecosystems are rated as ‘good’ at providing that ecosystem service. Likewise, intermittently connected ecosystems are ‘poor’ at providing ecosystem services relating to recharge discharge processes. The text at the bottom of the table shows the proportion of the Fitzroy Basin that is represented by natural areas (percentages) and where to focus improvements (target areas).
| Fitzroy Basin | Very frequently connected | Frequently connected | Intermittently connected | Infrequently connected | ||||
|---|---|---|---|---|---|---|---|---|
| Recharge-discharge processes | Very good | Moderate | Poor | Moderate | ||||
| Physical processes (sediments) | Very good | Moderate | Good | Very good | ||||
| Biogeochemical processes | Moderate | Moderate | Moderate | Moderate | ||||
| Biological processes | Moderate | Moderate | Moderate | Moderate | ||||
| 6% natural areas; target grazing pastures (5,537,979 ha) and grazing forests (1,911,285 ha) | ||||||||
| 6% natural areas; target grazing pastures (1,673,632 ha), grazing forests (505,731 ha) , horticulture (326,316 ha) and grazing forested floodplains (328,805 ha) | ||||||||
| 43% natural areas; target grazing of wetlands (1,141 ha) and grazing pastures (1,250 ha) | ||||||||
| 38% natural areas, 2% in conservation; target ponded pastures (17,309ha) and grazing (1,360ha) | ||||||||
Hover over the map below to view the overall ecological process score for each major catchment.
Scores show the percentage change in loss of ecosystem services for each catchment, compared to pre-European condition. Scores are ranked from lowest level of change (green) to highest (red).
Click on the catchments to show how individual ecosystem services score, compared to the varying levels of connectivity.
[wqip-data component=’eco-calc’ category=” parameter=”]