[wqip-tabs]
Blue Maps
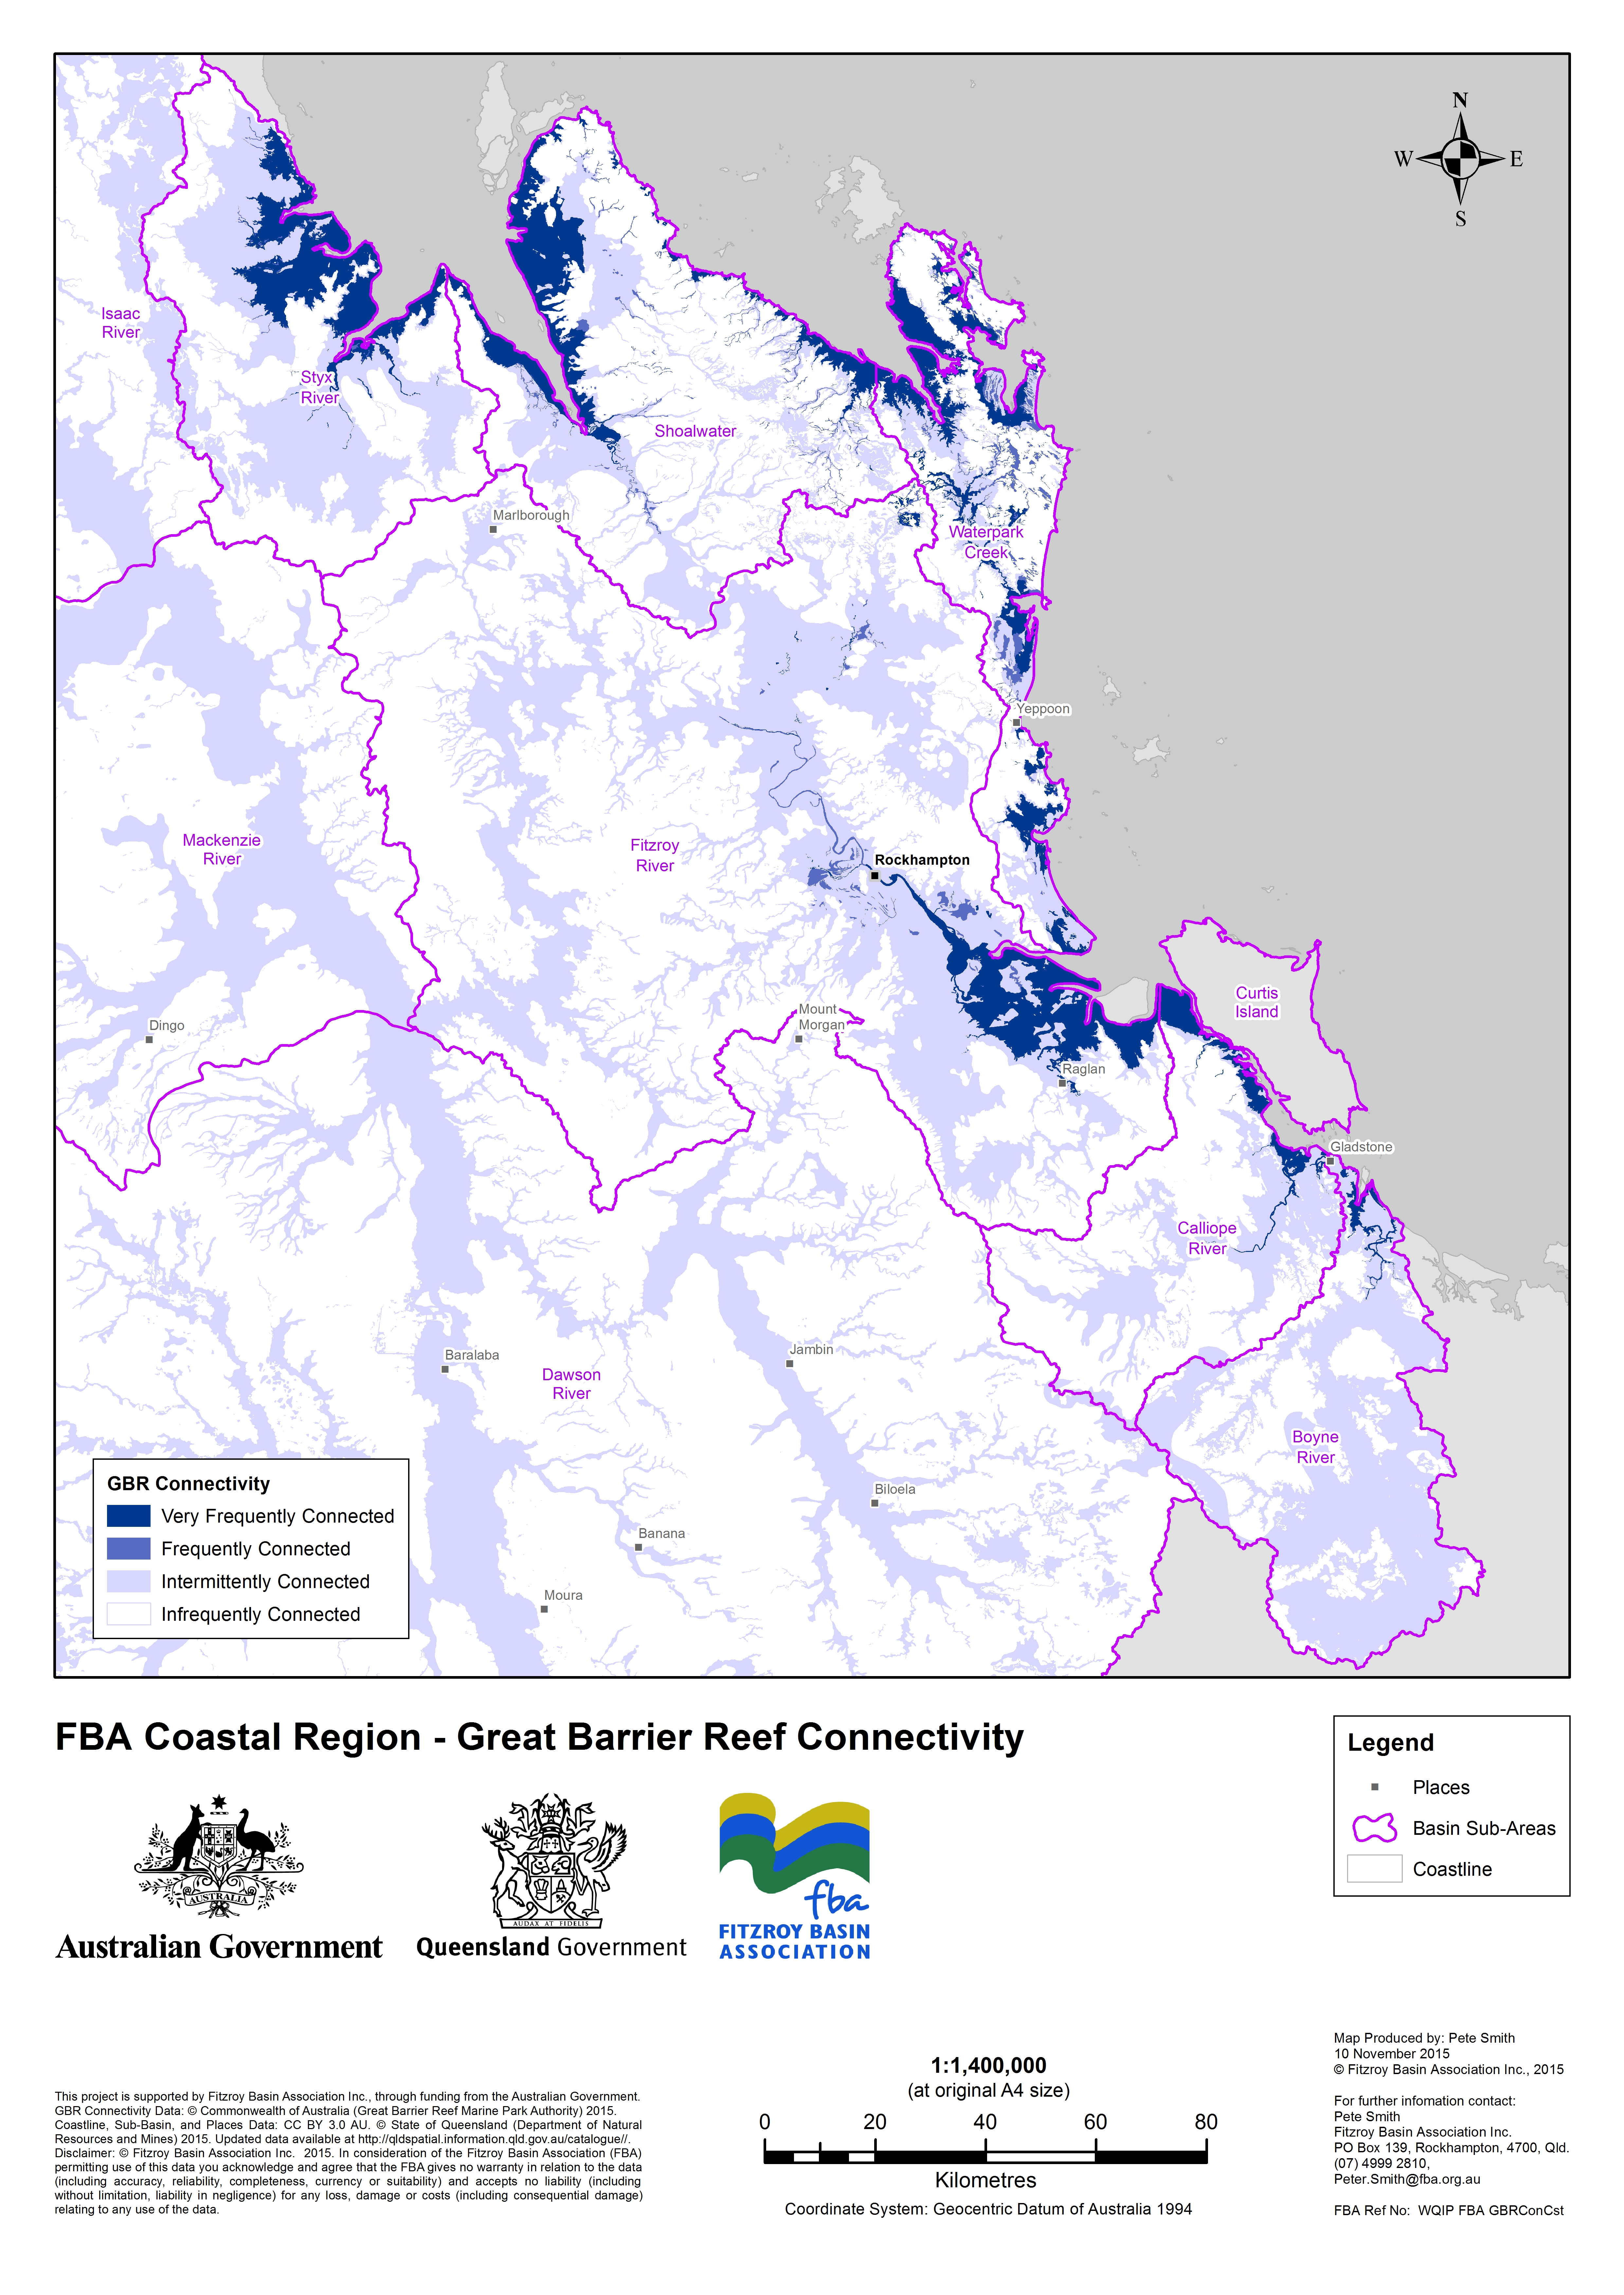
The importance of ecological processes and the capacity of coastal and modified ecosystems to deliver these processes with benefits to the Great Barrier Reef are often dependant on the proximity of the service area to the Reef. The Blue Maps developed by the Great Barrier Reef Marine Park Authority (GBRMPA) show the areas of strongest connectivity through the mapping of wetter areas of the catchment (refer to map of the Fitzroy Region below). Although the whole catchment is connected to the Great Barrier Reef, and some processes such as sediment transport can originate from the top of the catchment, many more processes occur where connectivity is greatest (typically closest to the coast). The Blue Maps identify those areas with the greatest value for the delivery of ecological processes that benefit the Great Barrier Reef.
Blue Maps are developed through analysis of a number of mapping layers and a combination of attributes that show areas of strongest connectivity to the Reef. FBA has used this information to help prioritise areas where ecosystem repair may be advantageous for improving water quality and other values such as biodiversity.

| Very Frequently Connected – Direct connections with the Great Barrier Reef occur on a diurnal basis. | |
| Frequently Connected – Direct connections with the Great Barrier Reef occur on at least a monthly basis. | |
| Intermittently Connected – Direct connections with the Great Barrier Reef occur for extended periods during seasonal, tidal and flood events. | |
| Infrequently Connected – Direct connections with the Great Barrier Reef occur through groundwater and overland flows during rain events. |


